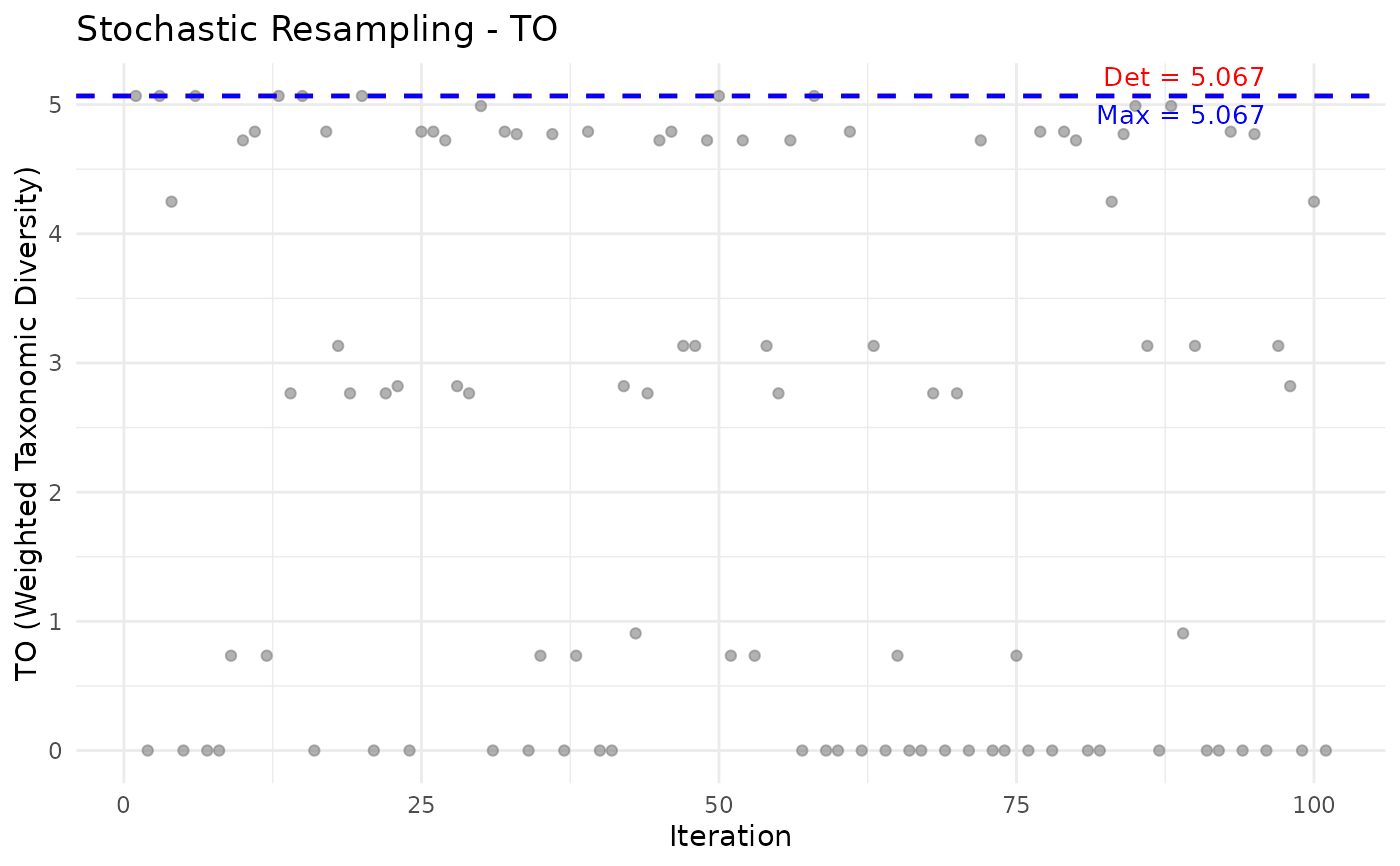
Visualizes the iteration-by-iteration pTO values from stochastic resampling (Run 2) or sensitivity analysis (Run 3). Each iteration's value is shown as a point, with the deterministic (Run 1) value displayed as a horizontal reference line.
Arguments
- resample_result
The list returned by
ozkan_pto_resample(Run 2) orozkan_pto_sensitivity(Run 3).- component
Character string specifying which pTO component to plot. One of
"uTO","TO","uTO_plus","TO_plus". Default is"TO".- title
Optional character string for the plot title.
Value
A ggplot object showing iteration values as points,
the deterministic value as a dashed red line, and the maximum
value as a dashed blue line.
Details
The plot includes three visual elements:
Grey points: Individual iteration values
Red dashed line: Deterministic (Run 1) value
Blue dashed line: Maximum value across all iterations
This helps assess how stochastic species removal affects the pTO index and whether the maximum exceeds the deterministic value.
Examples
# \donttest{
comm <- c(sp1 = 9, sp2 = 7, sp3 = 6, sp4 = 3)
tax <- build_tax_tree(
  species = paste0("sp", 1:4),
  Genus = c("G1", "G1", "G2", "G2"),
  Family = c("F1", "F1", "F1", "F2")
)
res <- ozkan_pto_resample(comm, tax, n_iter = 101, seed = 42)
plot_iteration(res, component = "TO")

# }
# }